Every quarter, publicly traded US companies release their earnings reports, giving investors insight into the financial health and performance of the business. These reports can drive massive stock price movements. But for many retail investors, they can seem overwhelming.
This guide breaks down how to read a US company’s earnings report like a pro — helping you understand what really matters, what to ignore, and how to use that information to make smarter investment decisions.
What Is an Earnings Report?
An earnings report is a quarterly disclosure of a company’s financial performance. In the US, it’s filed with the Securities and Exchange Commission (SEC) using forms 10-Q (quarterly) and 10-K (annual).
Each report typically includes:
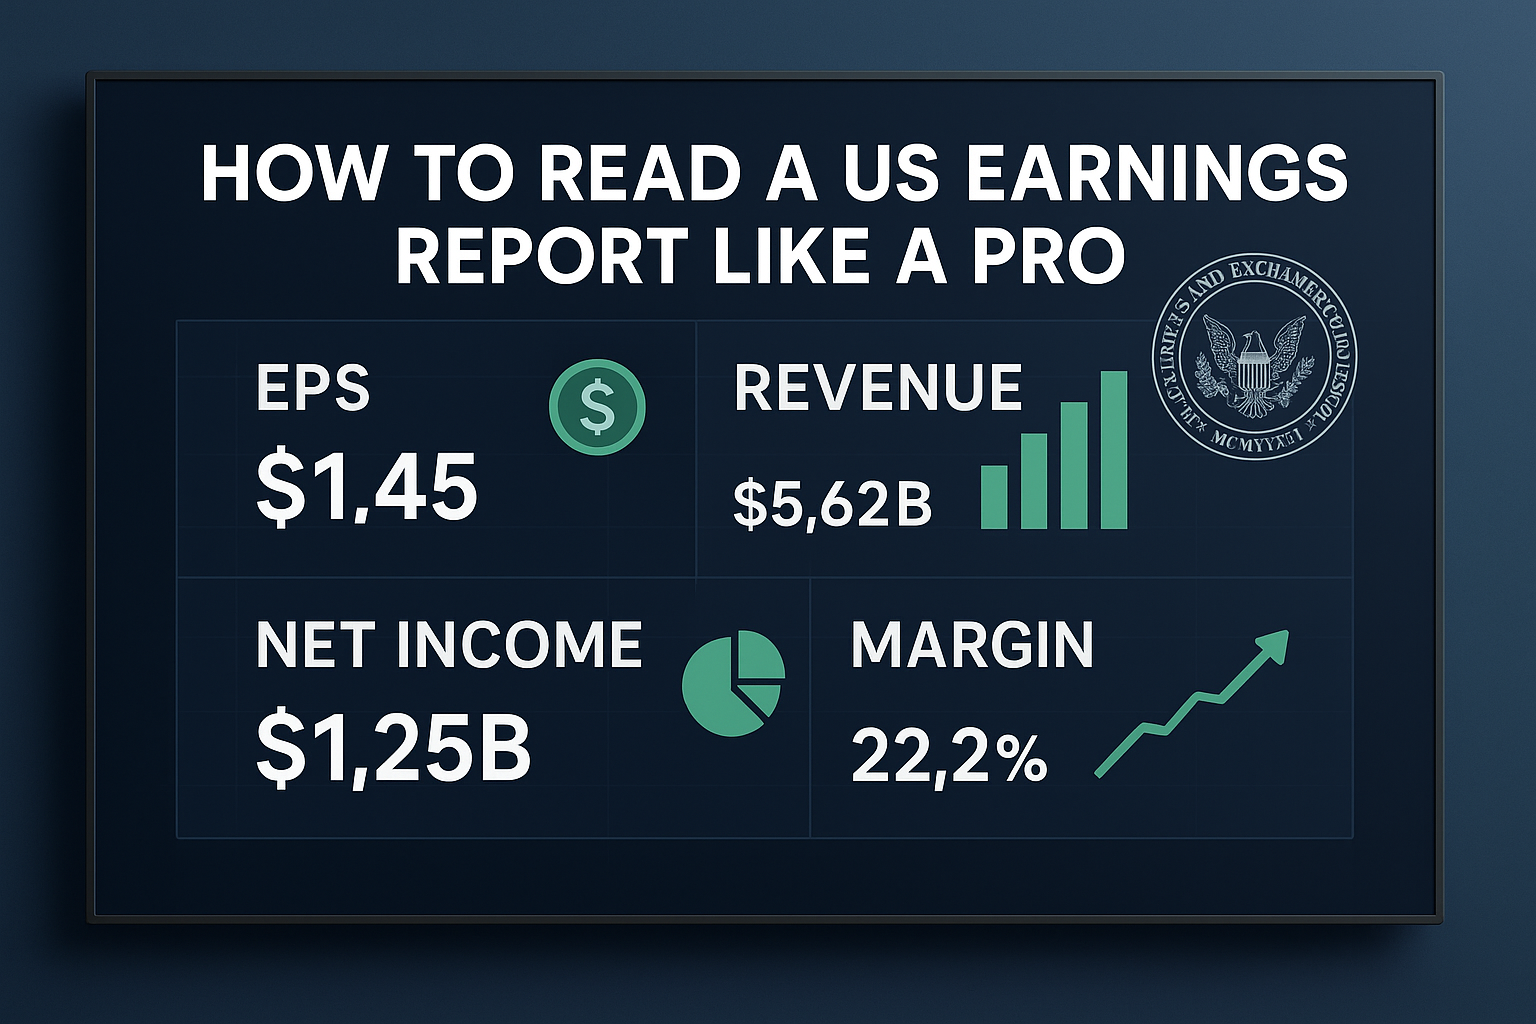
- Revenue (also called sales or top line)
- Net income (bottom line)
- Earnings per share (EPS)
- Operating income
- Margins (gross, operating, and net)
- Guidance (future expectations)
- Management commentary or press release
Companies also host earnings calls to discuss results with analysts and answer questions.
Key Sections to Focus On
1. Revenue
This is the total money the company brought in during the quarter. Look for YoY (Year-over-Year) and QoQ (Quarter-over-Quarter) growth trends.
2. Net Income and EPS
Net income shows actual profit. EPS (earnings per share) tells you how much profit is attributable to each share. There are two types:
- GAAP EPS (Generally Accepted Accounting Principles)
- Non-GAAP EPS (excludes one-time items like restructuring costs)
3. Margins
Margins help you understand profitability:
- Gross margin = (Revenue – Cost of Goods Sold) / Revenue
- Operating margin = Operating Income / Revenue
- Net margin = Net Income / Revenue
Higher margins generally indicate operational efficiency.
4. Guidance
Companies often provide future estimates for revenue, profit, and other metrics. Watch if they raise, reaffirm, or lower guidance — this heavily influences stock price direction.
5. Balance Sheet Highlights
Look for changes in:
- Cash and cash equivalents
- Total debt
- Inventory levels
These indicate financial stability and growth health.
6. Free Cash Flow (FCF)
Free cash flow is the cash a company generates after capital expenditures. It’s vital for dividends, buybacks, or reinvestment.
Example: Apple Inc. (AAPL) Earnings Breakdown
Let’s say Apple reports:
- Revenue: $117 billion (down 5% YoY)
- Net income: $30 billion
- EPS: $1.88
- Gross margin: 43%
- Guidance: Lowered next quarter’s revenue
Interpretation:
- Revenue decline may worry investors
- Strong EPS and margins suggest good cost control
- Lowered guidance could pressure the stock price
What Moves the Stock Price?
Stock reaction depends on whether results beat or miss expectations:
- Beat: Company outperforms Wall Street estimates
- Miss: Company falls short
Also:
- Better-than-expected guidance = bullish
- Weak margins or rising costs = bearish
- Positive tone from management = confidence booster
Red Flags to Watch
- Declining revenue across multiple quarters
- Shrinking margins
- Ballooning debt
- Aggressive accounting or repeated non-GAAP adjustments
- Missed guidance repeatedly
Tips for Retail Investors
- Don’t just look at headlines — dig into the numbers
- Read the press release and earnings call transcript
- Compare results with competitors in the same sector
- Use tools like Yahoo Finance, Seeking Alpha, or EDGAR for filings
- Track trends over several quarters
Final Thoughts
Earnings reports are the heartbeat of the stock market. Mastering how to read them gives you an edge over reactionary traders and helps you become a fundamentally informed investor. Focus on long-term trends and financial strength, not just one good or bad quarter.
By learning to read between the lines, you’ll make better decisions and avoid the noise.
Disclaimer: This article is for informational purposes only and should not be considered financial advice. Always consult a licensed financial professional before making investment decisions.